12 Mar 2015
If you have questions,
we have answers.
we have answers.
Occupations of debtors who have entered a personal insolvency.
- Commentary all debtors — Australian Financial Security Authority
- Most common occupations in 2013-14
- Occupations of debtors compared to the population
- Changes in occupations since 2010-11
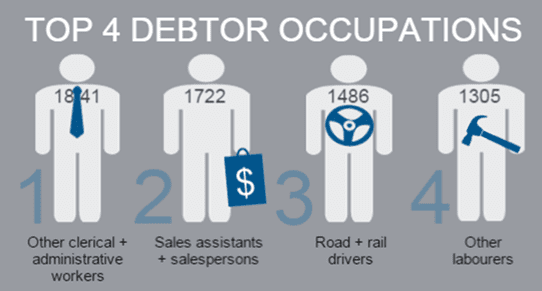
Most common occupations in 2013-14
The most common occupations of debtors who entered a personal insolvency in 2013‑14 were:
- Other clerical and administrative workers
- 1841 debtors
- Excessive use of credit was the most common cause of insolvency
- These occupations include:
- Logistics clerks,
- Conveyancers and legal executives,
- Court and legal clerks,
- Debt collectors,
- Human resource clerks,
- Inspectors and regulatory officers,
- Insurance investigators, loss adjusters and risk surveyors and
- Library assistants.
- Sales assistants and salespersons
- 1722 debtors
- Unemployment or loss of income was the most common cause of insolvency
- Road and rail drivers
- 1486 debtors
- Unemployment or loss of income was the most common cause of insolvency
- Other labourers
- 1305 debtors
- Unemployment or loss of income was the most common cause of insolvency
- These occupations include:
- Freight handlers and shelf fillers,
- Caretakers,
- Deck and fishing hands,
- Handypersons,
- Motor vehicle parts and accessories fitters,
- Printing assistants and table workers,
- Recycling and rubbish collectors and
- Vending machine attendants.
See the Causes of personal insolvency publication for more information on causes of insolvency.
Occupations of debtors compared to the population
The occupations with the highest proportion of insolvent debtors compared to the population in 2013–14 were:
- Other clerical and administrative workers eg logistics clerks
- 6% of insolvent debtors in 2013–14
- 2% of the employed workforce in the May quarter 2014*
- Other labourers eg handyperson, road traffic controller
- 4% of insolvent debtors in 2013–14
- 2% of the employed workforce in the May quarter 2014*
- Road and rail drivers
- 5% of insolvent debtors in 2013–14
- 3% of the employed workforce in the May quarter 2014*.
In contrast to the other common occupations of debtors, similar proportions of sales assistants and salespersons were insolvent compared to the workforce:
- 6% of insolvent debtors in 2013–14
- 6% of the employed workforce in the May quarter 2014*.
Changes in occupations of debtors since 2010-11
The highest increases in the number of debtors occurred in the following occupations between 2010–11 and 2013–14:
- Other clerical and administrative workers
- Insolvent debtors increased from 1652 debtors in 2010–11 to 1841 in 2013–14
- Employed workforce fell from 233,300 workers in the May quarter 2011 to 222,800 workers in the May quarter 2014*
- The largest increase in a specific occupation was in purchasing and supply logistics clerks.
- Construction trades workers
- Insolvent debtors increased from 1074 debtors in 2010–11 to 1253 in 2013–14
- Employed workforce fell from 378,800 workers in the May quarter 2011 to 368,200 workers in the May quarter 2014*
- The largest increase was in painting trades workers.
- Other technicians and trades workers
- Insolvent debtors increased from 721 debtors in 2010–11 to 888 in 2013–14
- Employed workforce increased from 174,300 workers in the May quarter 2011 to 194,000 workers in the May quarter 2014*
- The largest increase in a specific occupation was in hairdressers.